Most colleagues in the project management profession are familiar with what is often referred to as the Cost Influence Curve. Put briefly it documents the decreasing level of control to influence project costs as the project evolves in time. The best description of this concept was written by the late Stanford professor Boyd C. Paulson, Jr. In 1976 he wrote a landmark article in the Journal of the Construction Division (American Society of Civil Engineers) that brought together vague observations and applications from a variety of sectors and industries, and adopted the term “level of influence” to describe the concept.
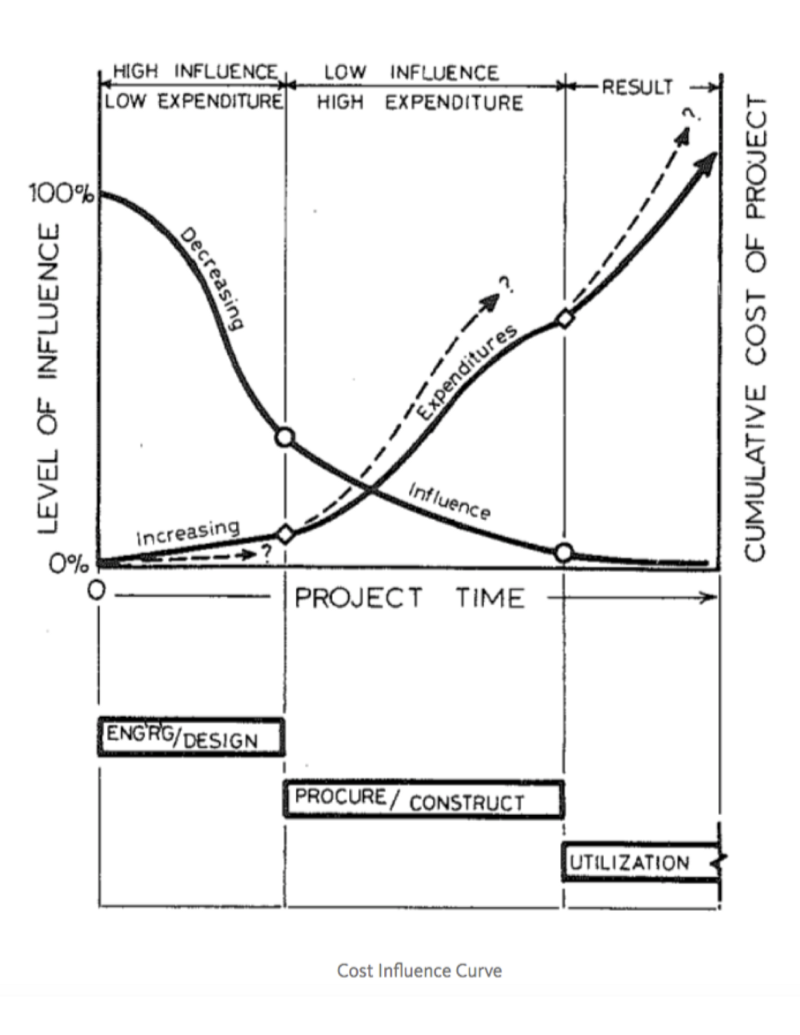
As the curve shows, on day one of the project, management has 100% level of influence in deciding the future costs of the project. This quickly dwindles. Studies are done to provide decision support to decide capabilities, design, options and facilities. With every step on the way commitments are made and decisions are getting more and more detailed. As a rough indicator Paulson suggested a 25% remaining level of influence by the time construction commences on a grass-root petroleum refinery. As such, the initial designers and decision makers have tremendous impact on how the project will end up.
This is all true, but the flip side of this is that this easily leads to a sense of resignation and complacency, which in turn leads to inertia. Once you hit the construction phase there is a perception that there is little you can do to influence costs — so why even bother trying?
Since the 1970s the projects have been getting significantly bigger, more complex and the stakes are higher — in other words, there are more “things” that need to come together towards the the end of the project. By now, we know that upfront planning is vital, but projects make it or break it in the execution phase.
Here are two recent examples that seem to have struggled in the later phases of the projects:
Yme project, Norway:
YME is a field in the Egersund basin in the southern part of North Sea, located in about 300ft water depth. The field was owned and operated by Statoil, but was closed down in 2001 due to low oil prices. Now it is being re-developed by Canadian operator Talisman Energy. Cost has ballooned from about $800+ million to 2+ billion due to problems finalizing the project — more specifically in the hook-up and commissioning phase of the project.
PSVM Project, Angola:
Overrun by $4 billion and one year late. The reason: “We probably underestimated the length of time it was going to take both doing the conversion in Singapore, and the extent of the installation activity in Angola,” said Regional President of BP Martyn Morris.
Another point that is often overlooked is the significance of the changing supply chain in the oil and gas industry. Rob Kretzers, Executive Vice President of Projects at Shell, spoke to this at a recent panel debate during the Offshore Technology Conference (OTC 2013). What used to be a supply chain where the larger fabricators manufactured most of what they needed themselves is now much more fragmented and highly subcontracted. He expressed concern about rising quality issues across the board as a result of the fundamental problem of outsourcing and loss of control and oversight with the supply chain. As a result of increasing complexity there is also a tendency that such quality problems surface later in the game, making them more costly to address.
To conclude — YES — you do need to make the right decisions early — but you must also sustain the effort throughout the whole project! I am a strong believer in that the Cost Influence Curve can be stretched significantly further out. By having expert personnel that follow sound project management practices and use efficient tools you can significantly reduce your risk of ending up with a disaster project.
